The Surprising Way Product Attribute Filters Can Influence Our Purchases-Part 2

Derick Davis is an Assistant Professor of Commerce in the McIntire School of Commerce at the University of Virginia. Davis’ research interests include the psychological underpinnings of consumer behavior as well as pricing and promotion effects. Davis teaches Blocks 3 and 4 in McIntire’s ICE curriculum and as a first-generation student himself, he particularly enjoys mentoring fellow, first-gen students. In Part 2 of his Two-Part Thoughts From the Lawn series, Davis continues discussing his research on product attribute filters and their helpfulness to consumers.
Part 2: The Surprising Way Product Attribute Filters Can Influence Our Purchases
Welcome back! To pick up where we left off, we were considering whether we would filter, evaluate, or choose differently when category-level product attribute information is presented as a range versus distribution. While filters are provided to help consumers navigate unfamiliar product categories and narrow options, can such tools influence which products we consider and choose in unintended ways? In my recent research article: https://academic.oup.com/jcr/advance-article/doi/10.1093/jcr/ucac026/6607593 I consider how presenting the distribution of attribute values (in our example [Figure 4], a graphical representation of battery life for all available wireless speakers; see left panel) versus just the range of values (in this case, the minimum and maximum battery life in the wireless speaker category; see right panel) can systematically affect how consumers evaluate products, filter product options, and make trade-offs to choose between options.
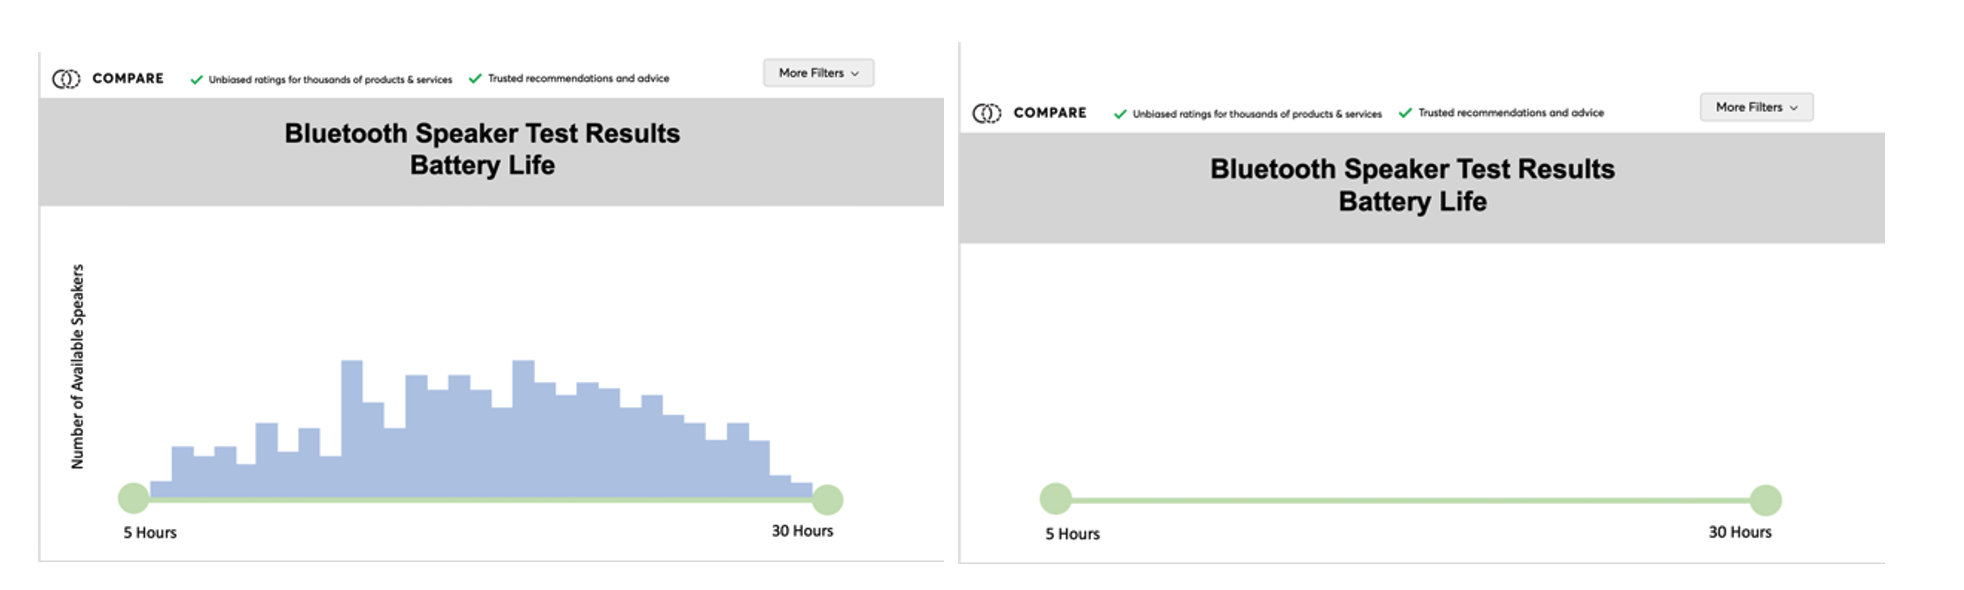
First, let’s review why managers may want to display product attribute distributions. Distributions should provide valuable information to consumers—if a wireless speaker had 25 hours of battery life, without a distribution could not discern its rank in the category—it could be the second-best or the second-worst product available! A distribution, however, would allow one to infer its approximate ranking with relative ease. Similarly, depending on the shape of the distribution, one could infer that there are distinct subgroupings of products (i.e., many speakers with shorter battery life, only a few with long battery life). However, any advantage due to displaying distributions is predicated on consumers effectively integrating that information into their judgments and decisions. What if that is not the case?
Indeed, I find it is often not the case. In fact, consumers are instead distracted by distributions, especially for unfamiliar products and attributes, and more generally for consumers who lack strong numerical backgrounds. This distraction means that consumers pay less attention to differences between attribute values, which affects judgments that involve comparisons of attribute values, such as filtering, evaluating, and choosing with these tools. Specifically, attribute values are treated as being more similar when presented with a distribution (i.e., in general, a difference between 20 and 25 hours seems smaller when presented on a distribution). What might that look like in terms of your search for a wireless speaker?
- When filtering wireless speakers by attributes, you would select a wider band of values if a distribution was displayed on the attribute filter because the minimum and maximum values you select seem relatively more similar on the distribution. This means more inferior products are included in your search.
- When evaluating a speaker that has 20 hours of battery life, you would evaluate it more positively on a distribution (relative to a range), as it seems more similar to the best available speaker. This might mean you are willing to accept a more inferior product with a distribution.
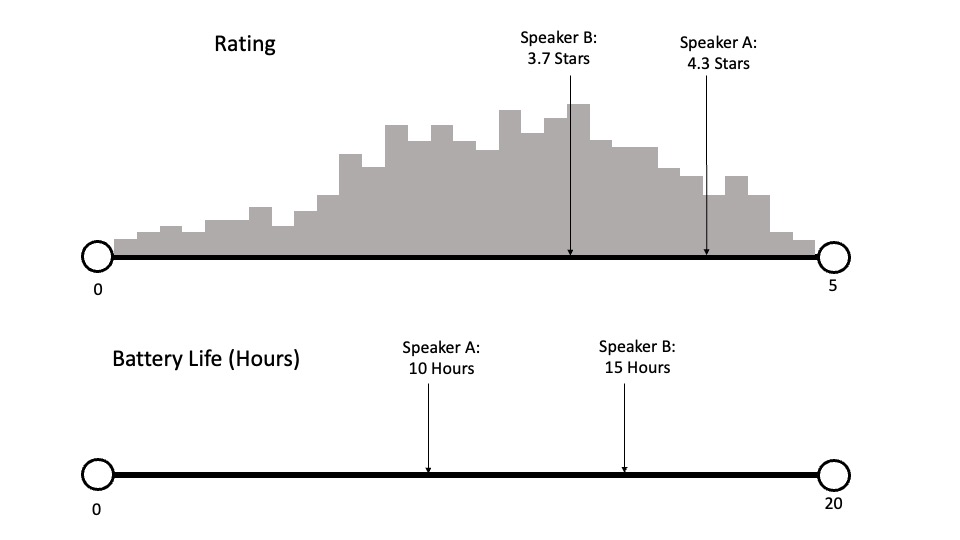
- If you were choosing a speaker by comparing two options based on their battery life and rating, and battery life was presented with a distribution and rating was not (Figure 5A), differences in battery life would not factor as strongly in your choice. Why? Because the differences in battery life between options seem smaller; thus, you will likely choose the higher-rated option, speaker A compared if battery life was presented without a distribution (Figure 5B). These ratings would seem more similar, and you would likely choose the speaker with longer battery life, speaker B. In other words, your preferences are influenced by the format of the information you are considering.
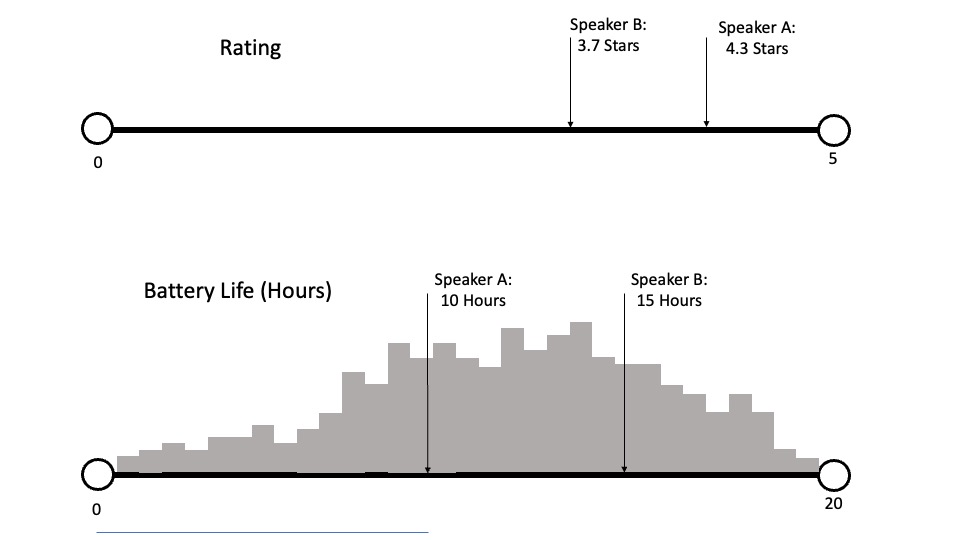
Figure 5A
Surprising right? Of course, which product attributes are displayed and how they are displayed is determined by the retailer. As consumers, we must wrangle with product information in the manner it is provided. How can we help ensure we are making the best decisions?
In my view, knowing that distributions can influence judgments and decisions is the first step. Unfortunately, this means we still need to do our due diligence, especially for decisions with larger consequences. In other words, while many of us, myself included, are happy these tools can help us navigate options, we need to be diligent and rely on multiple sources of objective information.
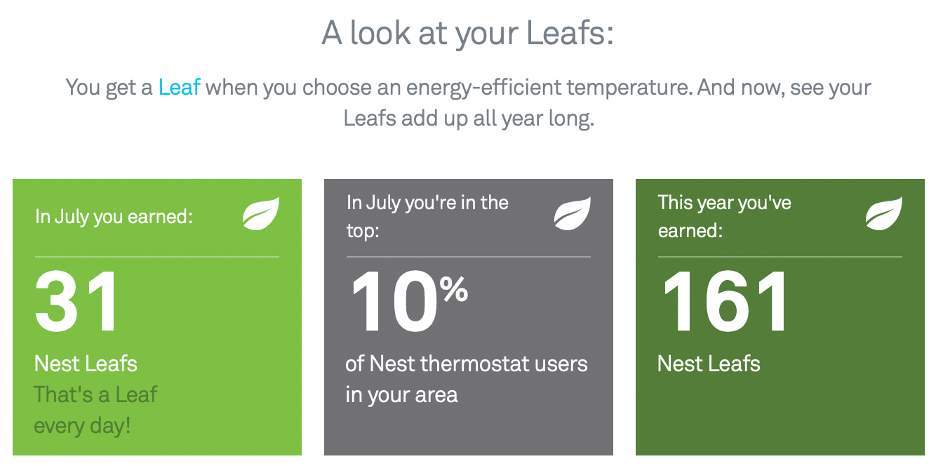
Additionally, my research has implications for other areas where category-level information can be displayed. For instance, many firms either manage consumer-to-consumer transactions (e.g., Airbnb, eBay, Etsy) or help consumers compare their performance to others on some metric (e.g., Google Nest, Strava). In the former case, firms have an interest in helping sellers set reasonable prices. Could they display the range or distribution of selling prices for similar offerings to aid sellers? Similarly, in the latter case, Google Nest sends monthly emails to users comparing their performance to others in their area (Figure 6). Can Google identify which consumers should be more motivated by their position on the distribution, or the range, of local Nest users, and change how this information is displayed? Could that impact their energy consumption?
In sum, there is a lot left to learn about how consumers interpret and use numerical information, such as distributions. We tend to like numbers and numerical information as they seem objective and precise. Firms try to help by providing this information, and even aggregating and graphically displaying large amounts of information in a distribution. In practice, however, for a variety of reasons, we often have difficulty using this information in the way intended.
- Musings on National Violin Day
- Making the Promise Real: How a UN Tax Convention Can Fulfill the UNDHR’s Vision
- Having a Drink With Your Donkey: The Absurd in Antiquity
- UVA Club of Atlanta: Virtual Pilates Class
- UVA Club of Fairfield/Westchester: Cavs Care - Food Pantry Donation Drive
- UVA Club of Washington DC: December Book Club