The Surprising Way Product Attribute Filters Can Influence Our Purchases-Part 1

Derick Davis is an Assistant Professor of Commerce in the McIntire School of Commerce at the University of Virginia. Davis’ research interests include the psychological underpinnings of consumer behavior as well as pricing and promotion effects. Davis teaches Blocks 3 and 4 in McIntire’s ICE curriculum and as a first-generation student himself, he particularly enjoys mentoring fellow, first-gen students. In Part 1 of his Two-Part Thoughts From the Lawn series, Davis discusses his research on product attribute filters and their helpfulness to consumers.
Part 1: Product Attribute Filters and Similar Displays: How Do (or Don’t) They Help Us?
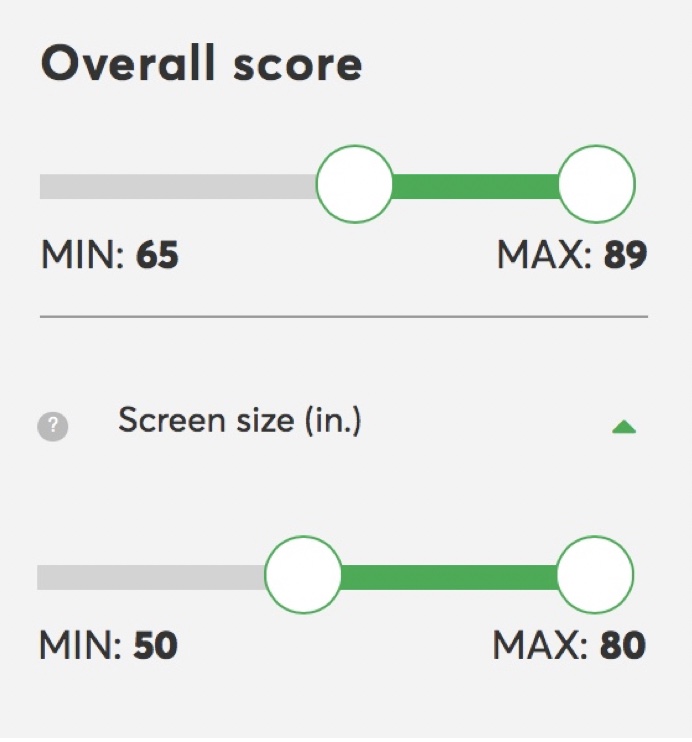
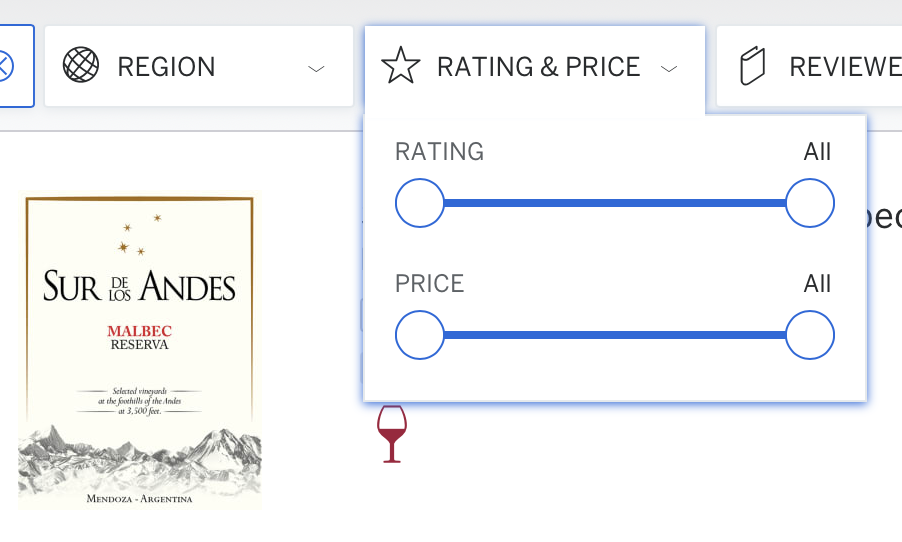
Have you ever considered product attribute filters—those humble tools provided on many apps and websites that present the range of attribute values for products within a category? These product attributes (e.g., price, rating, size, weight, capacity, energy efficiency, battery life, and/or other performance metrics etc.) are both important to consumers and can vary widely across competing products in the category. Product attribute filters can help consumers parse through large categories by selecting only those products with acceptable attribute values (or at least what they think are acceptable at the time). These filters are often displayed as range sliders, especially on smartphone applications, and present the minimum and maximum attribute values for products in the category. See Figures 1A, 1B, and 1C for examples.
Are they as helpful as they seem at first blush?
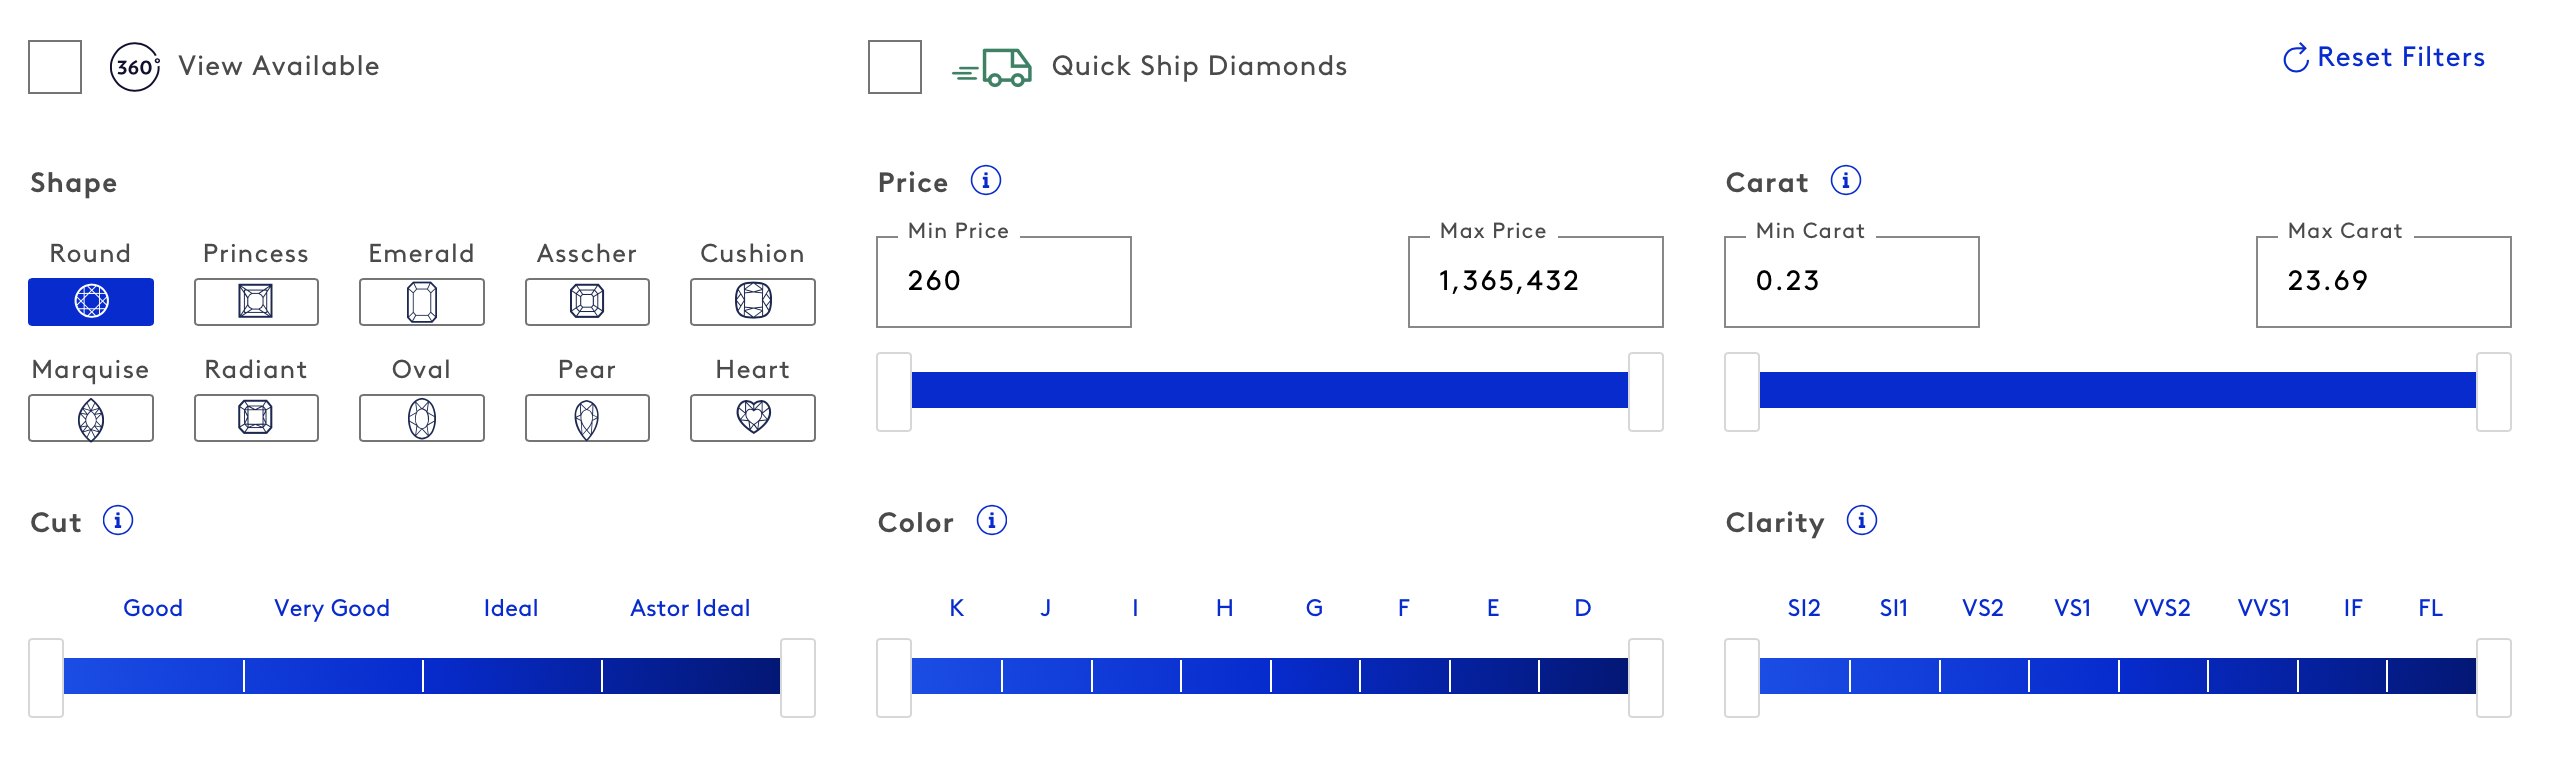
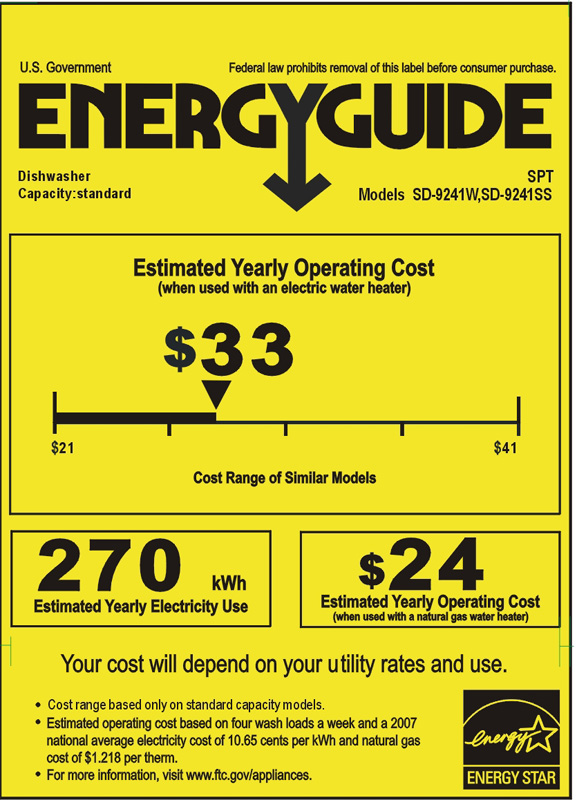
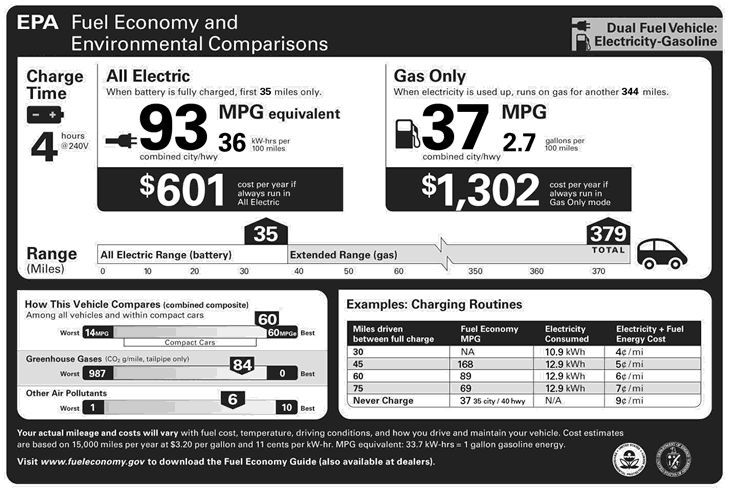
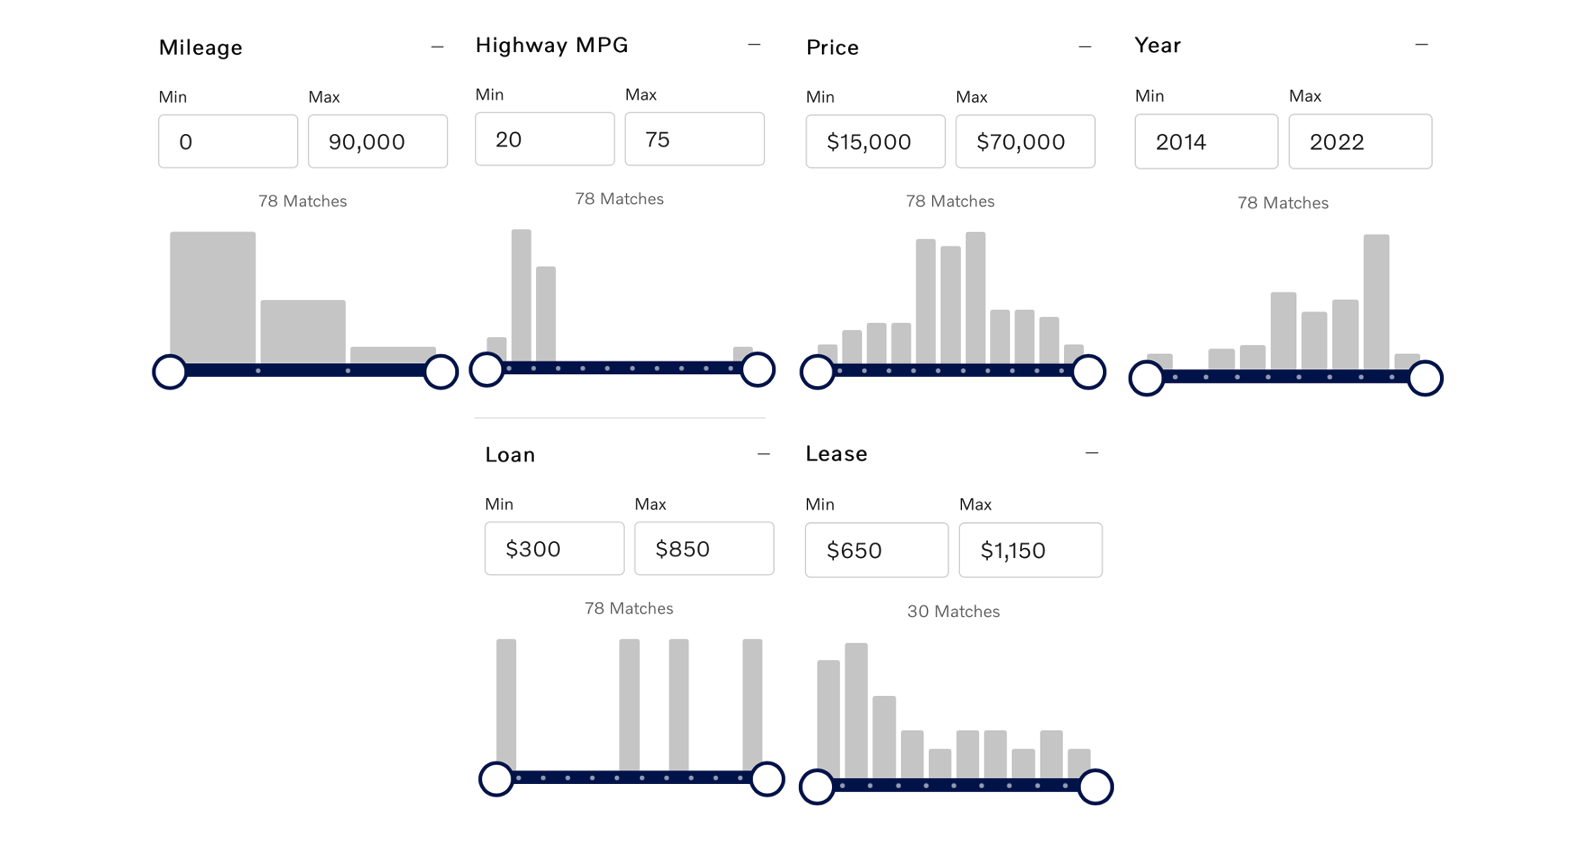
Most of us have used a product attribute filter like these without giving it much thought. Similarly, many of us have purchased products with government-mandated labeling (e.g., EnergyGuide labels or greenhouse gas ratings on automotive window stickers, Figure 2A and 2B, respectively), which also display the minimum and maximum values in the category along a horizontal line. Consider the EnergyGuide label displayed (Figure 2A), that particular dishwasher is expected to use $33 in electricity a year, while comparable models use between $21 and $41 per year. What is a consumer to make of this information? They might find the dishwasher to be acceptable, as it is closer to the best value. The reality is that this dishwasher could be the second-best or the second-worst dishwasher available! Without displaying the distribution of product values along the range, there is no way to determine how that product ranks in the category. This also applies to product attribute filters. Without the underlying distribution of values, it is hard for consumers to really know much about products they are including or excluding when filtering. Some firms apparently have realized this issue and do provide attribute filters that display the underlying distribution (Figure 3). There is a great deal of variability in how this type of information is presented, which indicates firms are experimenting with/learning how to display this information. Do consumers respond differently to these two formats (just the range versus the distribution of values) when filtering, evaluating, and choosing products?
To illustrate, imagine you want to buy a Bluetooth-enabled wireless speaker; you start shopping on a large online retailer and see there are over 4,000 options (yes, 4,000) in this product category. Daunting, right? Especially since you are not overly familiar with the products in the category. However, to you, battery life is the most important attribute to consider, and thankfully the retailer provides a filter for that attribute. What if you were presented the attribute filter on the right in Figure 4?
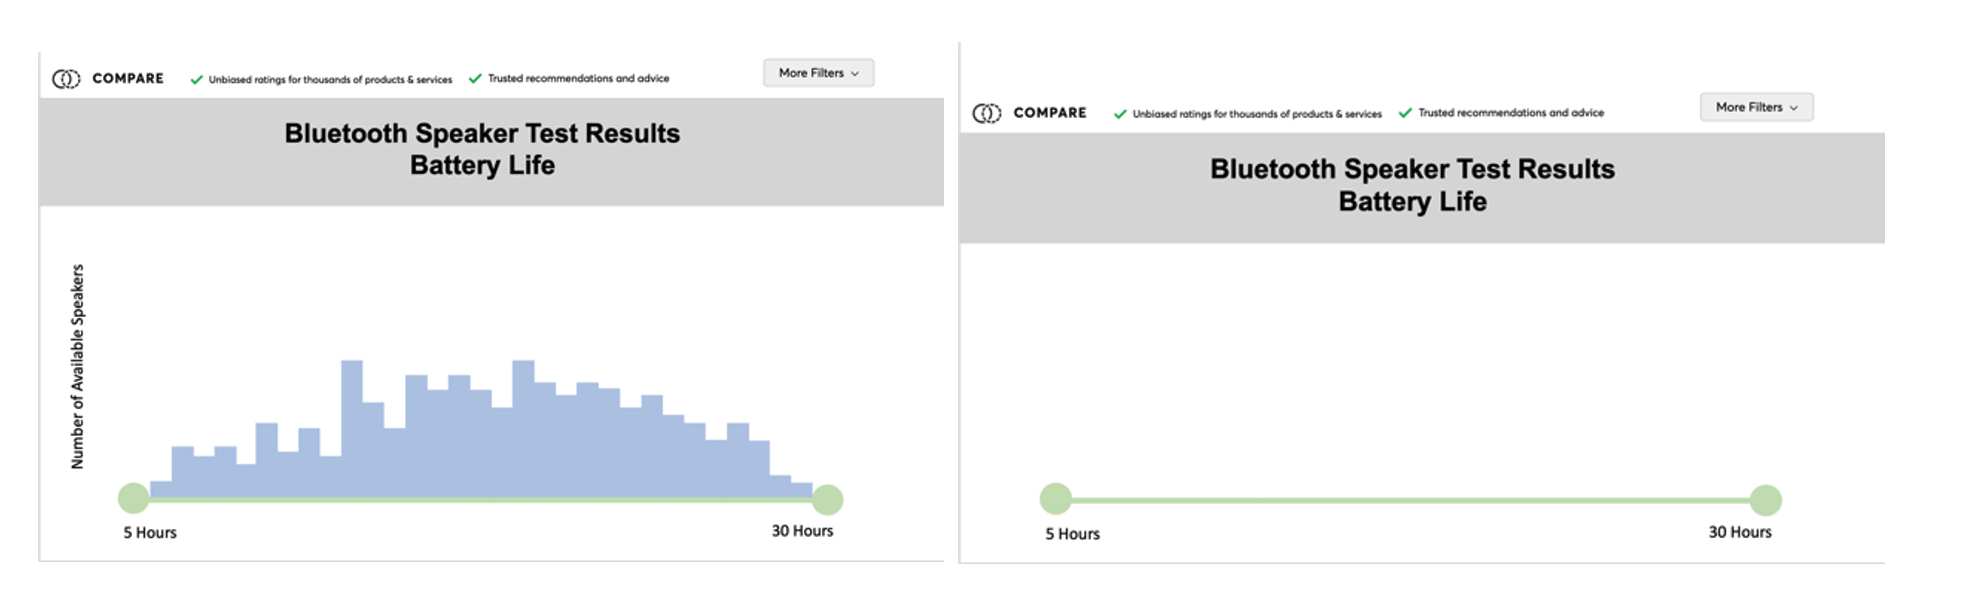
How far would you drag the green circles to filter options? Now how about for the filter with the distribution on the left? Any changes to how you would filter the options? Similarly, if the retailer suggested a speaker with 25 hours of battery life, would you evaluate it differently when viewing the filter on the right versus left? What if price enters the picture and price also has a filter with or without a distribution, might that affect how you trade-off price and battery performance in your choice? Chances are that you believe your responses would be affected by the presence or absence of the distribution (you are right!). However, my research suggests that the effect a distribution has on your judgments and decisions is likely much different than you might think.
In the forthcoming Part 2 of this two-part post, I will discuss the surprising way product attribute filters (and similar displays) can influence our purchases.
- Having a Drink With Your Donkey: The Absurd in Antiquity
- What Happens to UVA’s Recycling? A Behind the Scenes Look at Recycling, Composting, and Reuse on Grounds
- Finding Your Center: Using Values Clarification to Navigate Stress
- UVA Club of Atlanta: Virtual Pilates Class
- UVA Club of Fairfield/Westchester: Cavs Care - Food Pantry Donation Drive
- UVA Club of the Triangle: Hoo-liday Party